How Analytics Has Changed Football Over the Past Decade

Even the most fanatic of college football fans has probably never heard of Mike McRoberts. Most have probably never heard of Championship Analytics, Inc. either. McRoberts never set out to change the game of football, but he has. It all started around 2013.
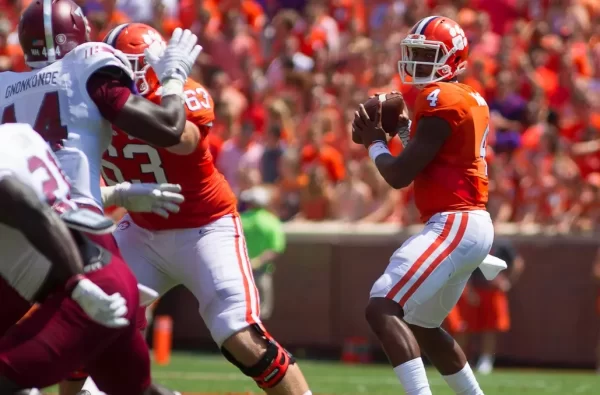
By 2016, the impact of what McRoberts brought to the game was being displayed on Saturdays and Sundays in the fall. In 2016, Troy trailed No. 2 Clemson, 10-3, in the second quarter. Facing a fourth-and-1 from its own 34-yard line, then-Troy head coach Neal Brown did something that would make Bear Bryant roll over in his grave. He went for it.
Brown, of course, was armed with the knowledge that McRoberts’ company – CAI – provides. The analytics suggested that Troy should go for this first down since the Trojans would have a greater chance of winning. Jabir Frye took a jet sweep handoff and went 66 yards for a touchdown on that fourth down play. Clemson would go on to win 30-24, but the age of analytics was born.
McRoberts’ and his company have had one of the biggest impacts on football over the past 10 years. It’s interesting because McRoberts had no background in sports. He played intramurals at Northwestern and he was a huge football fan. His interest was piqued when he saw coach after coach make what he thought were wrong decisions.
He started digging into the numbers looking at what coaches did on fourth downs. McRoberts looked at how coaches used timeouts and when they attempted two-point conversions. Armed with his degree in biomedical engineering, McRoberts started crunching numbers. He used a variety of factors – point spreads, win probabilities, fourth-down conversion rates, and much more.
In 2016, McRoberts patented his creation, known as the CAI Game Book. It’s not really a book, but more of a collection of charts that are customized weekly with recommendations for various situations – fourth down, for example – that coaches are faced with each week.
In 2013, McRoberts mailed his charts to 100-plus college programs and six NFL teams. The only one that responded was Troy University whose offensive coordinator at the time happened to have a math degree. The Trojans loved it and for his efforts McRoberts got some Troy tickets and Trojans’ swag. Then, his “book” took off.
Former Montana State head coach Rob Ash joined the company in 2014 and has been an integral part of growing the company. CAI’s client list now includes 70 of the 131 FBS programs in the country. Four NFL teams, 25 FCS programs, and 70 high schools or small college programs use the company’s services.
Teams that use CAI have a higher touchdown percentage rate in the red zone. They attempt 25 percent more fourth downs and, of course, have a higher fourth-down conversion rate than non-CAI teams. Using the company’s products has changed the mindset of many coaches.
Take TCU head coach Sonny Dykes. He used CAI at SMU before taking the job at TCU this year. His Horned Frogs are currently in the CFP Top 4. In a game against Navy last season while he was at SMU, his offense faced a fourth-and-1 from its own 34. Facing an option team like Navy, CAI’s book said to go for it. The result was a 66-yard touchdown pass which later turned into an SMU win.
As college and pro football fans and bettors continue to watch games, they may notice that teams are becoming more aggressive. They will go for it more on fourth down. They will attempt more two-point conversions. In 2021, no one went for it more on fourth down than Ole Miss head coach Lane Kiffin. Kiffin and the Rebels set an NCAA record by going for it on fourth down 49 times. They converted 31 (63.3%) of those. That is the impact of analytics on football.


